

Bitcoin Weekly Open #7

Dear Traders,
Today is the 22nd June 2020, let’s get another daily technical breakdown published and talk about some of the recent moves we have seen on both the LTF and HTF charts. I hope this newsletter helps to explain in more detail my current bias for PA and where I think we could be heading over the coming days, weeks, and months! Enjoy!
(I write this newsletter daily to subscribers, breaking down the markets in general and also providing my live trades in our private telegram channel, feel free to subscribe)
Daily Technical Breakdown
Welcome back to another ‘Weekly Open’, it has been a pretty quiet and uneventful weekend in general and price was pretty much just hovering around that $9350 level which we have seen for the past few days. This morning the market seems to be moving in the right direction, price is currently up over 2% and ETH up around 5% which is great to see as the bulls make another attempt to pick up momentum.
Of course from here the logical resistance level that will be crucial on this daily and weekly level is $9500, if bulls gain control of this level and flip it back into support then this could be a really crucial moment for PA and we could see a run higher to break above $10,000 which would be super interesting to see. 4H is currently showing resistance at $9500 so my plan here would be to wait and see how this level holds up over the next 12H and then see if you want to enter either a short or a long position,
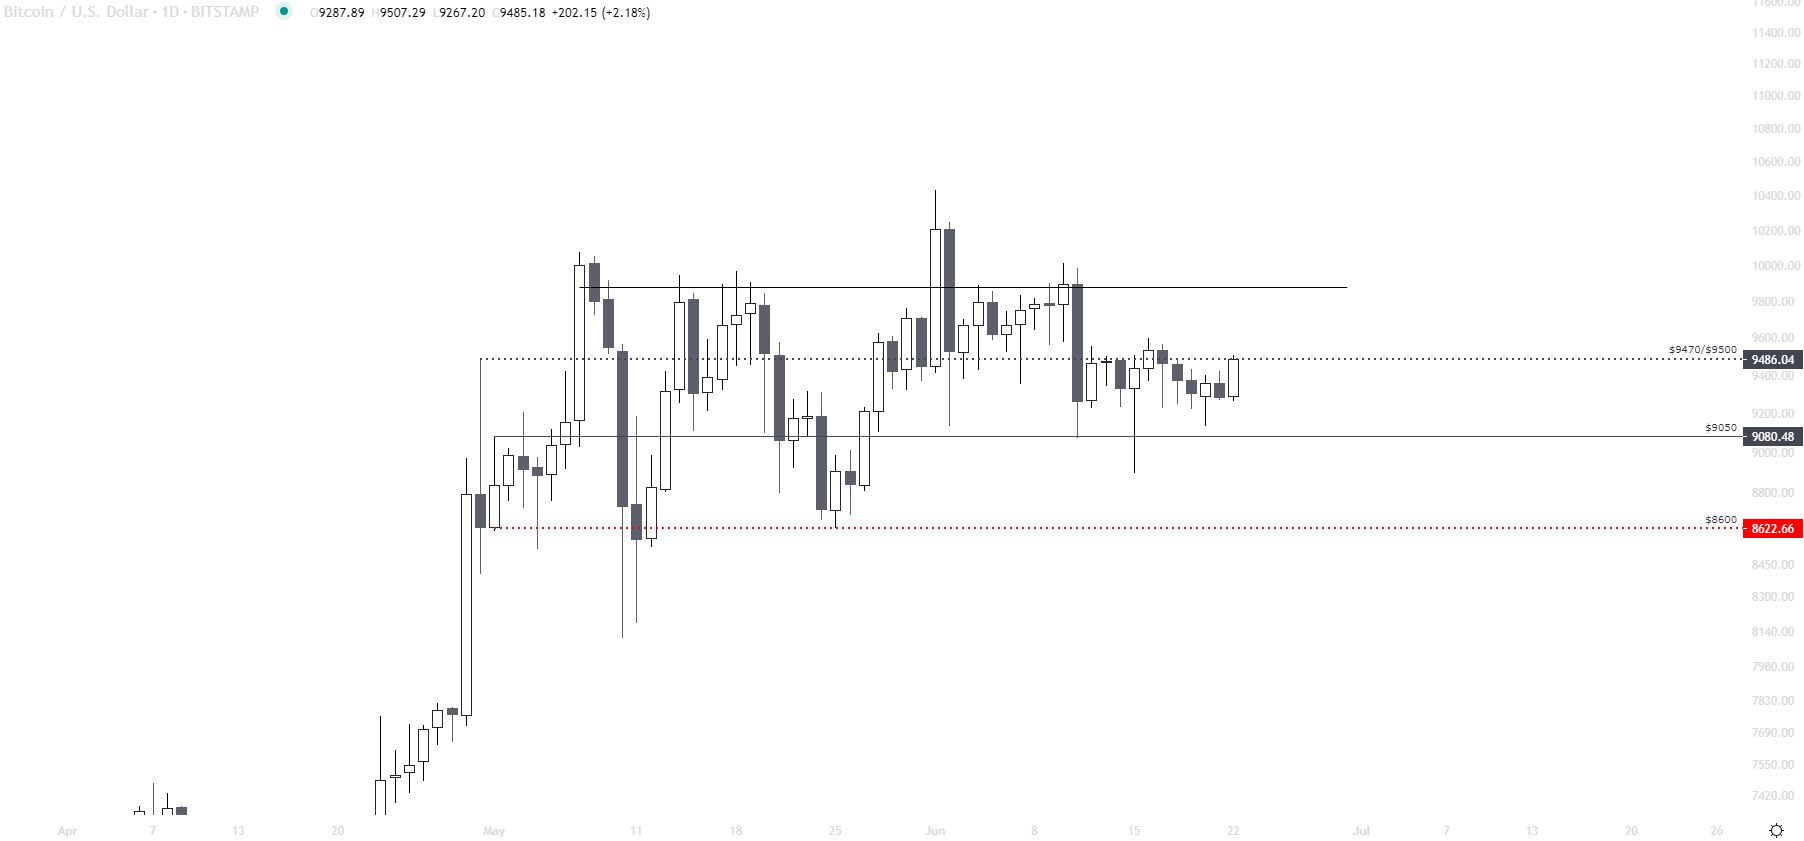
If we get a close above $9500 on a 4H candle then if the level seems to be holding as support throughout the daily close then I think a decent long position could be taken with pretty low risk as long as you are not overleveraging.
Overall, very happy that PA continued to hold around range low around $9050/$9100 even though we have been ranging for quite some time now, it shows that bulls do still have some power left and are willing to start taking the risk with fresh longs. As I mentioned over the weekend this week I am starting to expecting PA to see a lot of volatility and heavy buy/sell orders start to flood the market, the outflow of BTC on exchanges last week hit an ATH and it seems a lot of funds are being moved around!
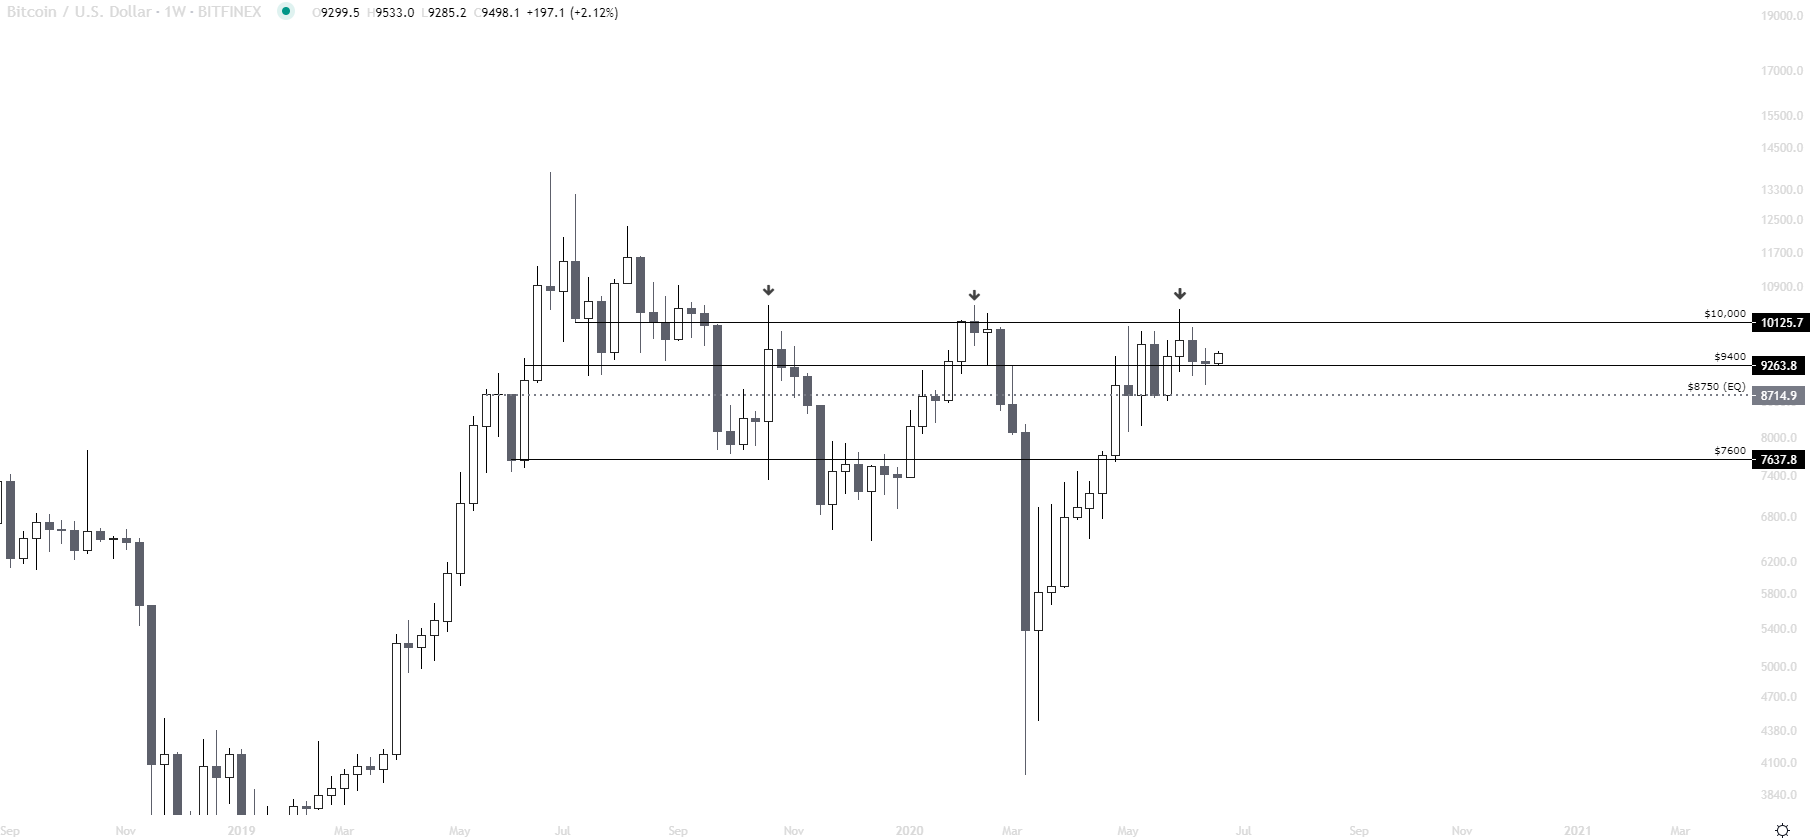
As you can see in the weekly chart above, it seems out HTF support levels are still in good standing this time, and it generally look as though the price is accumulating above $9000 for the first time in years. Previously price has always found very quick candles to the upside when price is above $9000 as likely people start to get excited that price revisits ATH’s, but this has not been the case and then price drops back below. This time we seem to be holding above $9000 steadily for the first time in years without seeing huge amounts of volatility and momentum.
Just from looking at the chart above and considering price seems to be holding up these HTF support levels so well, the next logical place for price to start testing is $10,000. I think price is currently looking super healthy and I think there could be some very good upside on the horizon just from looking at this HTF chart.
⭐️ SPONSOR ⭐️
This newsletter is made possible by our sponsors PrimeXBT, Prime is the exchange that I use on a daily basis to place my main leverage trades for both BTC & ETH. I got so annoyed with other exchanges having order book and order submission issues I had to find an exchange that actually placed my order and was super reliable… that’s Prime!
Also, PrimeXBT is giving readers of this newsletter an additional incentive to sign up today, If you want to get a 50% bonus on any deposit up to 1 BTC (bonus is for trading only) then please use code ‘CACTUS50’, and if you would like to get 25% off all your fees on the exchange then use code ‘CACTUS25’. Happy trading everyone!
This is currently the only leverage-based platform that I am enjoying trade on!
If we also quickly just take a look at ETH/USD as PA seems to be very bullish right now in my opinion. Take a look below at the chart which has been attached, as you can see price held up very well at HTF supports around the $226 region. The next resistance level I would be watching from here around be $275 which is a +15% move from current price, so there could be a very good opportunity for a nice long setup.
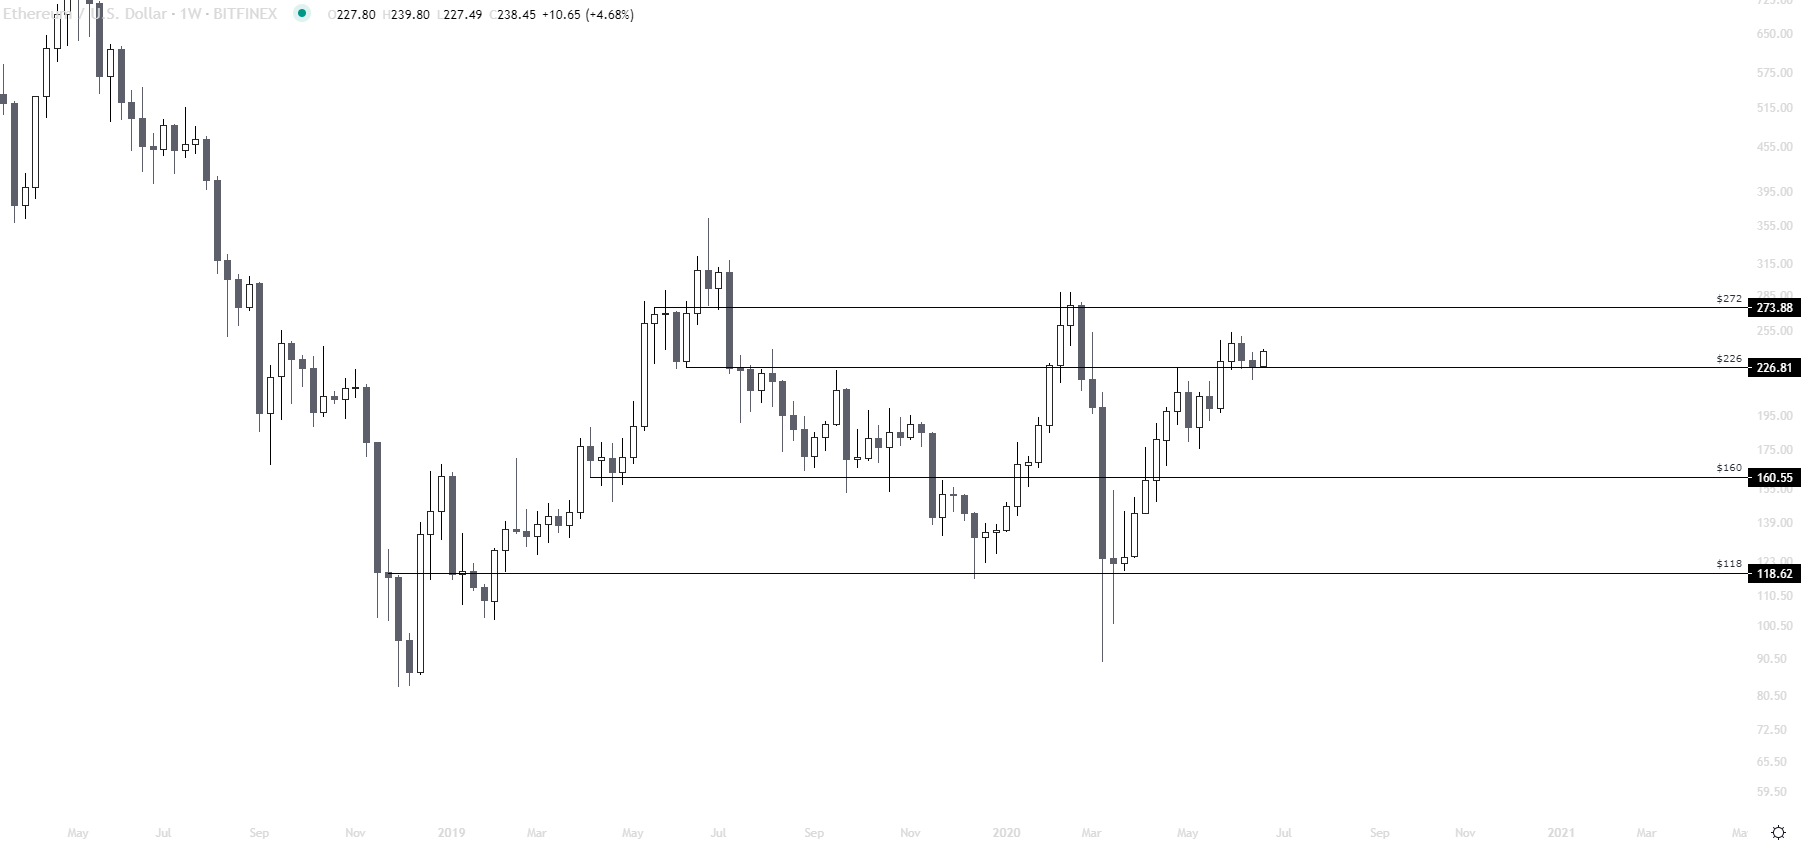
If you failed to buy in that $226 region previously then the next logical place to look for a fresh long position would be on the retest of $234 is we see this over the coming days. If we do get this retest and it seems to hold up pretty well as support, this would be where I would take a fresh long position with the likely chance that PA is just forming a HL and price will continue this uptrend to $250 and then $275.
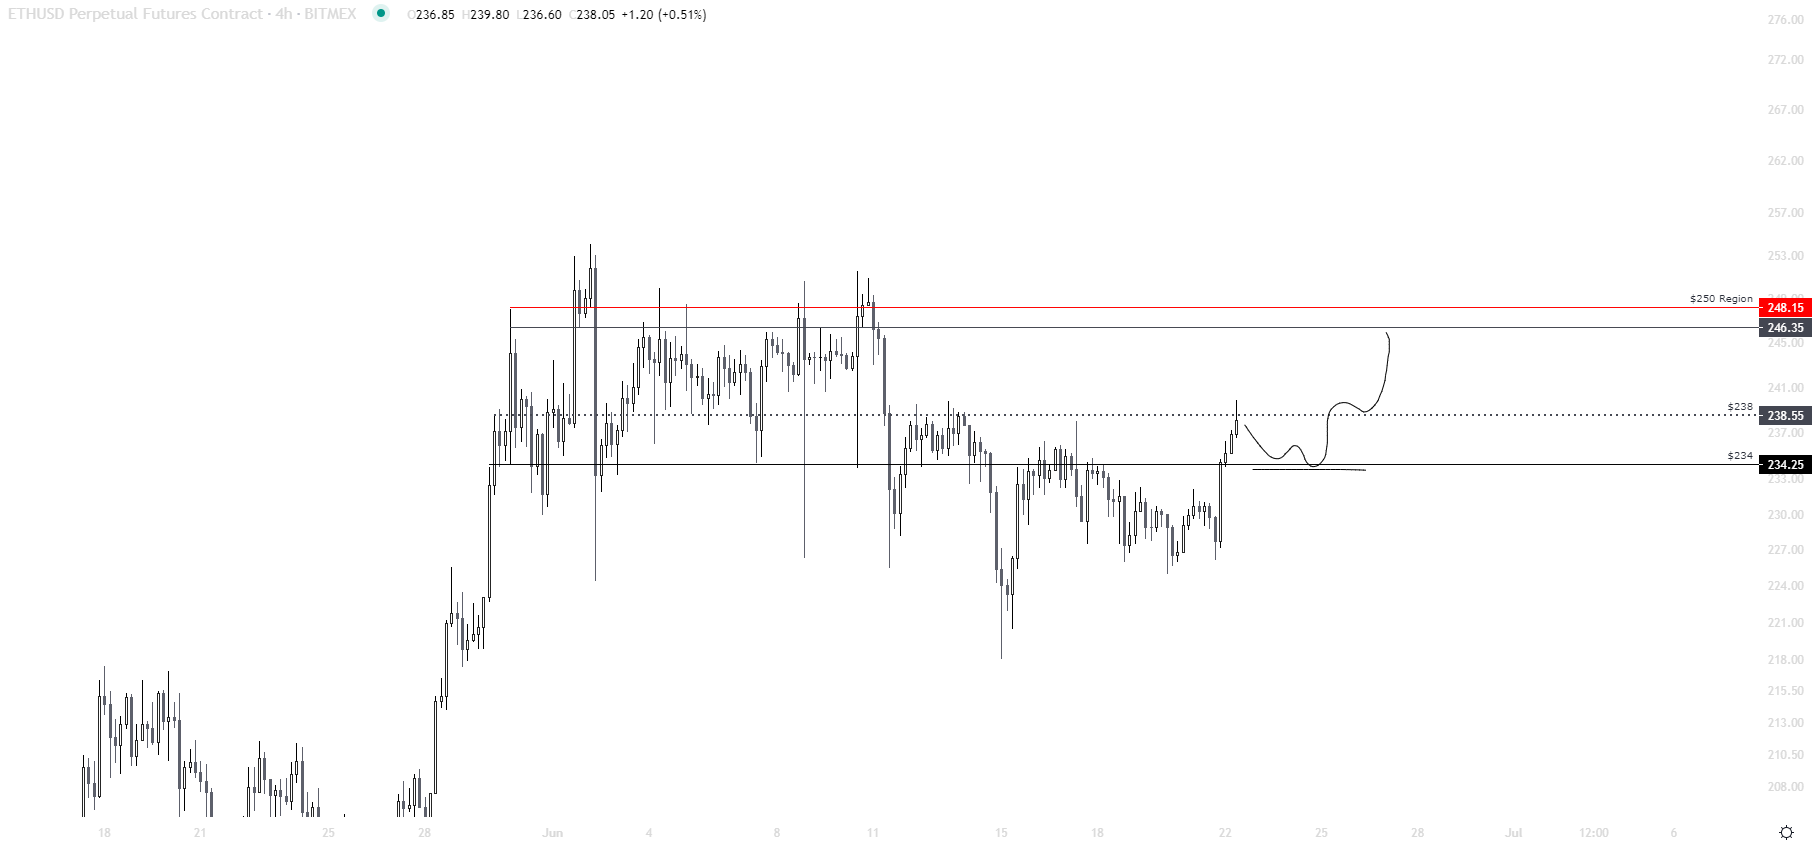
Just to go into a little more detail as to what I was talking about above, you can see that LTF support at $234 is a crucial level for overall price action. If we see price retest this level which should be pretty likely I will look to enter a fresh long position. Price is now back inside our range after this morning’s move so our RL should now be technically acting as support. $238 currently seems to be actively working as resistance so getting a retest of the RL is highly likely looking at current price action.
If price smashes through our middle range level (EQ) then our retest of $234 would be a little less likely to get retest and instead we would be looking to enter a long position at around $238 once this level gets flipped and starts acting as support. Overall I think putting a take profit (T1) around our range high of $250 is a great level for start.
- Thanks for reading Cactus