On-chain Metrics - Bitcoin On-Chain Activity Growth & Opensea Marketshare Slides
Market Report #225
28 September 2023
This newsletter is dedicated to sharing on-chain analysis for both Bitcoin and Ethereum, a Bi-weekly report that looks at some of the trending changes and movement on-chain so that subscribers can stay up to date with key information.
This report will run alongside the trading and price action based newsletter that usually gets written once a week, this should allow for subscribers to get the best of both worlds, a free newsletter covering on-chain data and trading/charts. If you are new here, please do subscribe, and thanks for everyone who supports this newsletter.
Addresses At a Glance
Going midway into Q4, there are signs on-chain that indicate mid to long term growth in the market.
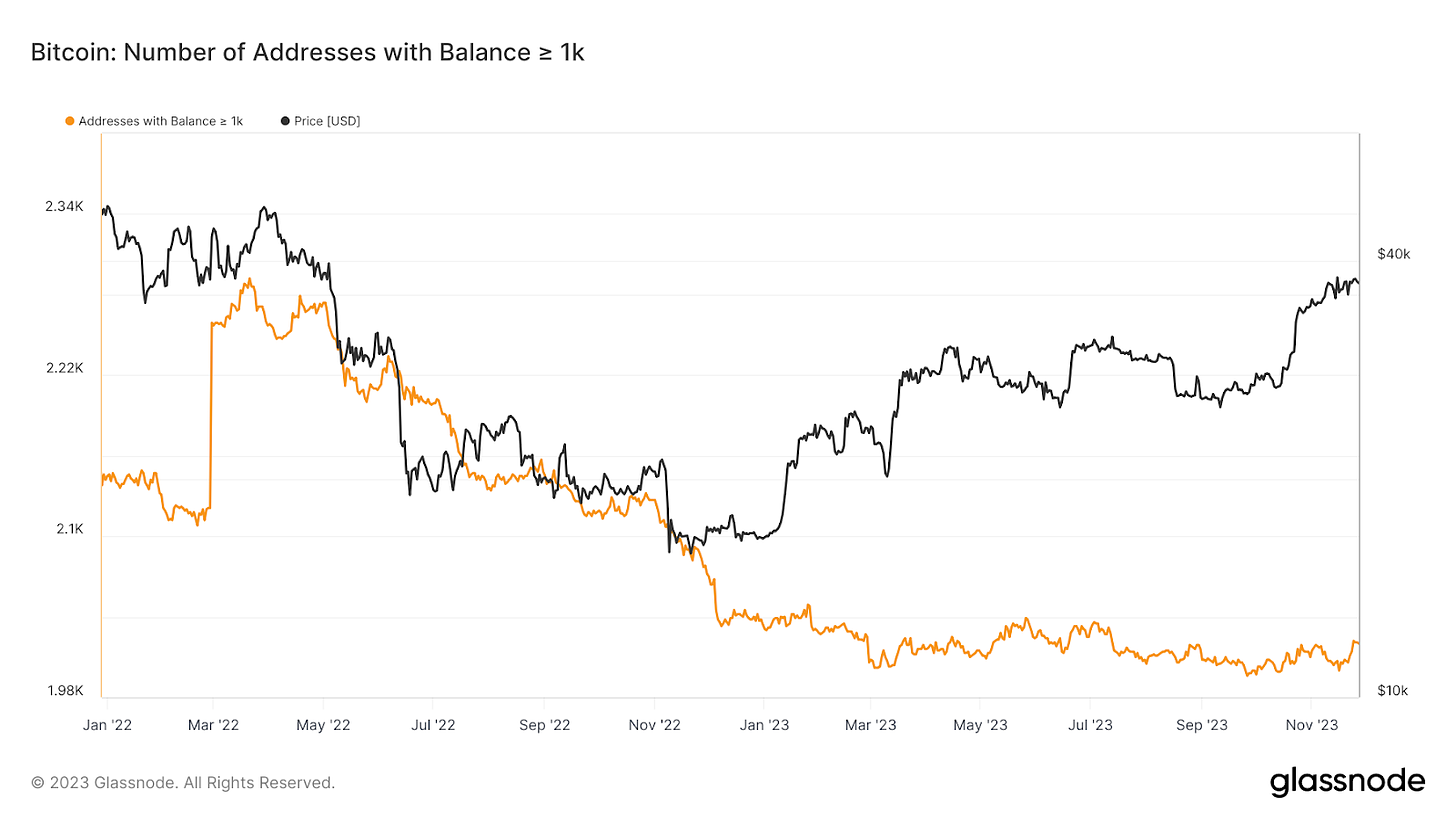
The number of Bitcoin addresses with a balance higher than $1,000 in BTC value have increased to over 2,000 addresses, which is a 1% increase in the past 7 days. This is a significant move despite the 1% change and the largest upward change since February 2022.
Comparing balances to their USD value, the addresses have increased 16% in the same timespan. This is an indication that addresses are increasing in both USD and BTC value.
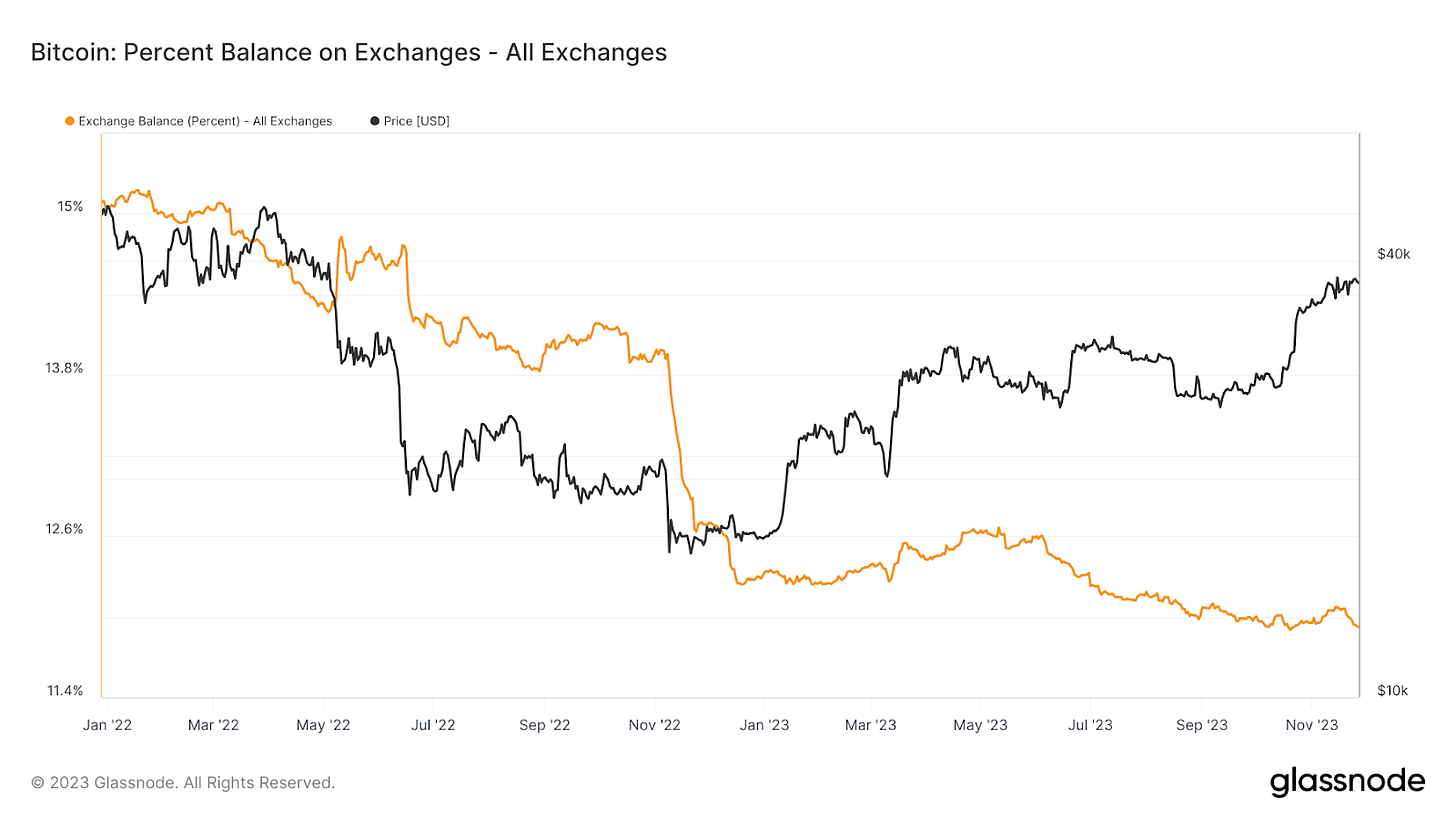
Focusing on known addresses owned by exchanges, we can see a sharp decrease of BTC on-chain. Metrics show that mid November addresses are at a 5 year low at 11.9% ownership, mirroring February 2018 ownership.
There are different ways this data could be interpreted such as a focus on users using DeFi, exchanges having BTC off-chain, or from a change of data transparency and on-chain consolidation. Also worth noticing that since Binance had been targeted by the SEC, percentages of addressed owned by changes have been in rapid decline.
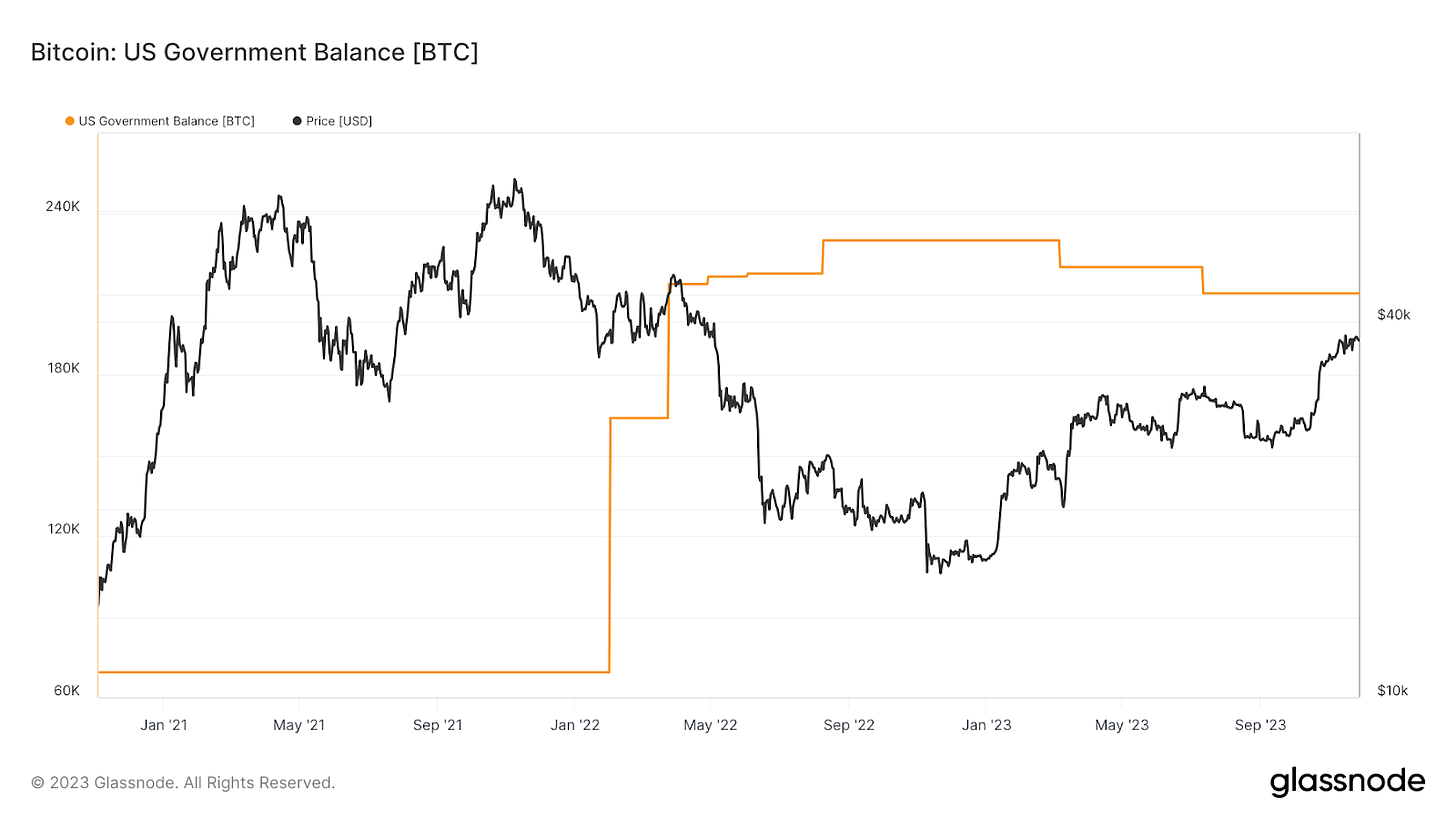
Speaking of Binance, there was a settlement made earlier this month with the US Government for Binance to pay $4.3 Billion. The US Government has high interest in seizing BTC and targeting crypto companies, with much controversy surrounding their intentions as the USD holds relatively strong amongst world currencies. BTC owned by the US Government is actually down 10% over the course of the last 12 months. It is worth noting that 80% of this supply is a result of legacy actions like the 2016 Bitfinex and 2012 Silk Road events.
Activity is Increasing and Manifold in Form
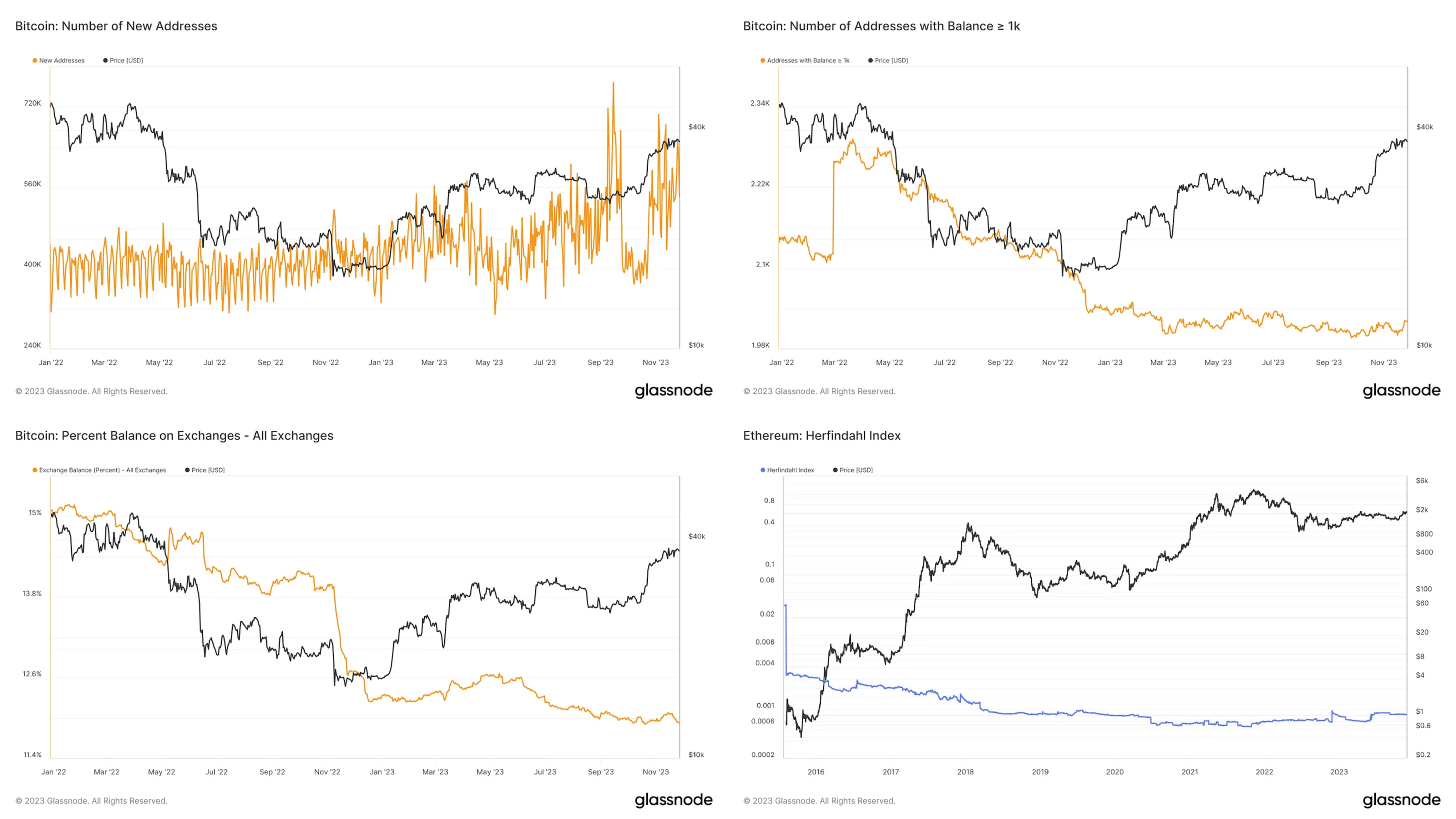
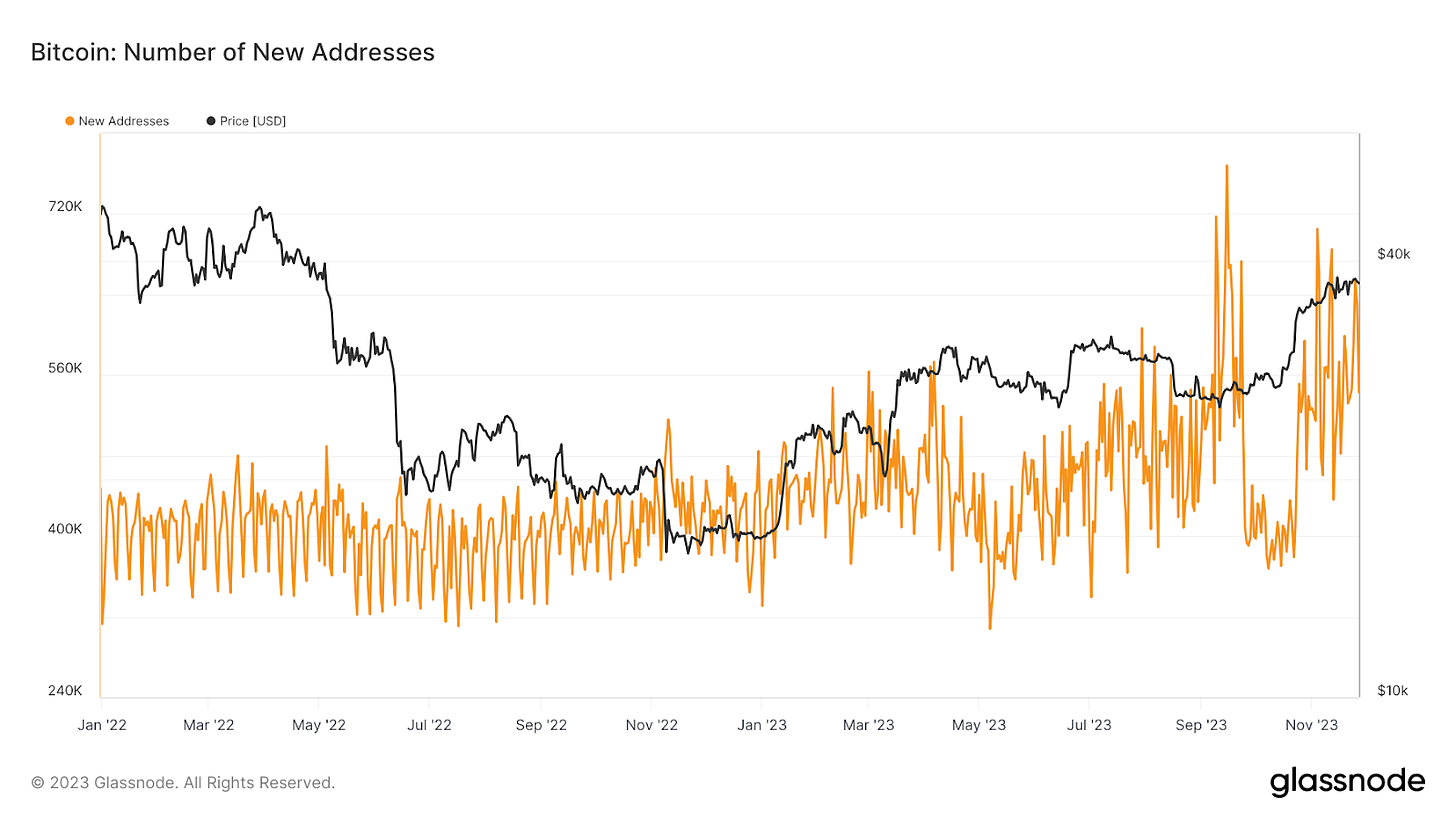
Taking a quick look at BTC, we can see both a sharp increase short term and a smoothed increase long term on BTC address activity. New addresses are approaching 600,000 which is the 6th highest increase in the last 24 months. It's also worth noting that all 6 of these higher volume days have all been recorded within the past 3 months. Complimenting this increased fluctuation, these increases are almost double the volume from addressed in Q1 2022.
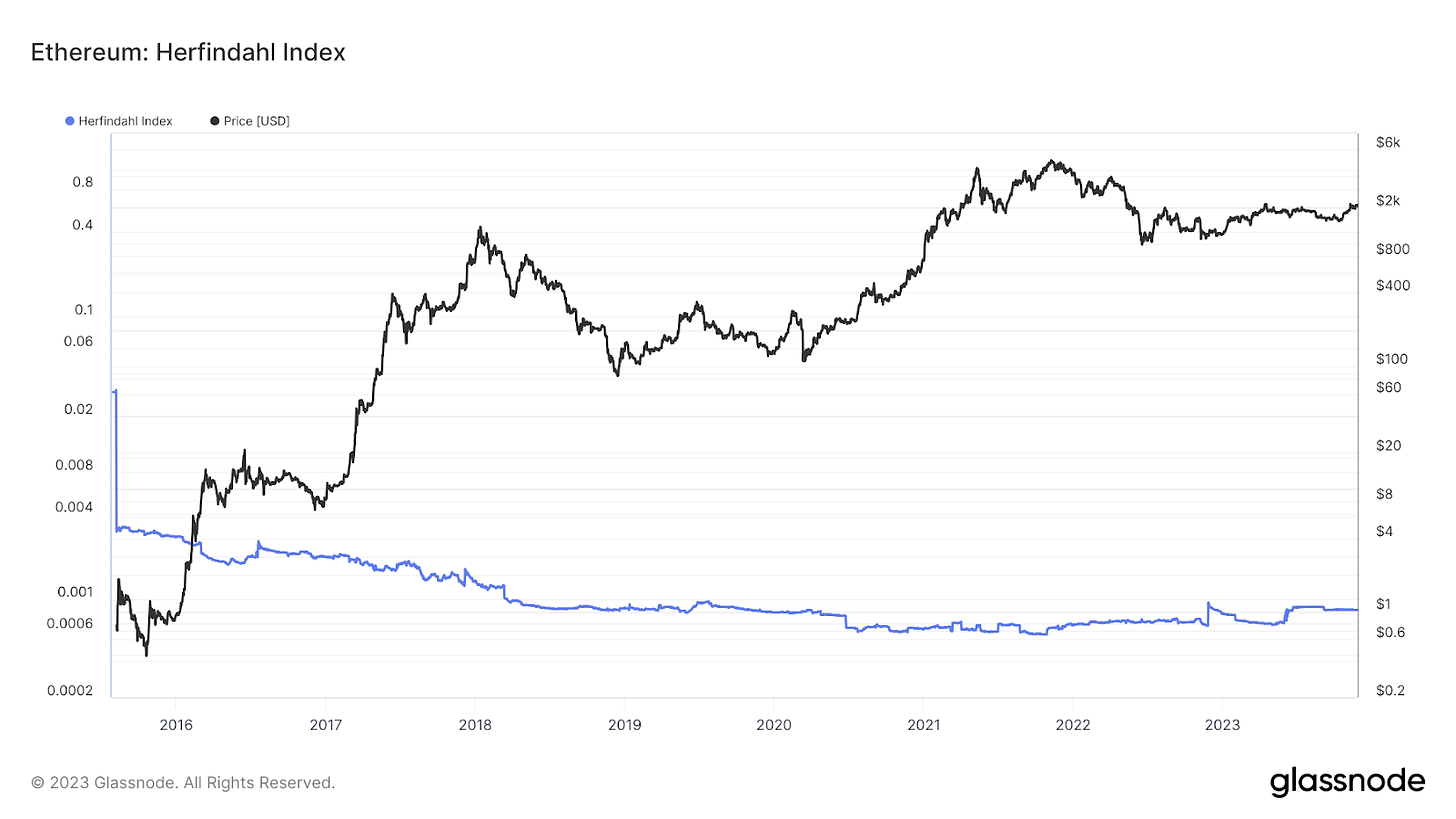
Supply on Ethereum is taking a turn toward larger balances and more siloed activity, with an increased supply concentration of over 23% this year using something called the Herfindahl Index. This metric has been almost exclusively on the rise since the top of the previous cycle.
NFTs have regained some interest with the emergence of BTC Ordinals and NFT activity has taken a massive shift over the course of 2023. A majority of users are changing how the find and exchange NFTs, with OpenSea having a paltry 11% market share compared to its highs at 50% in October 2022.
Independent NFT exchanges have risen to 92%, likely with the increased interest in 1:1 pieces over massive collections, and niche NFTs like photography and generative art.
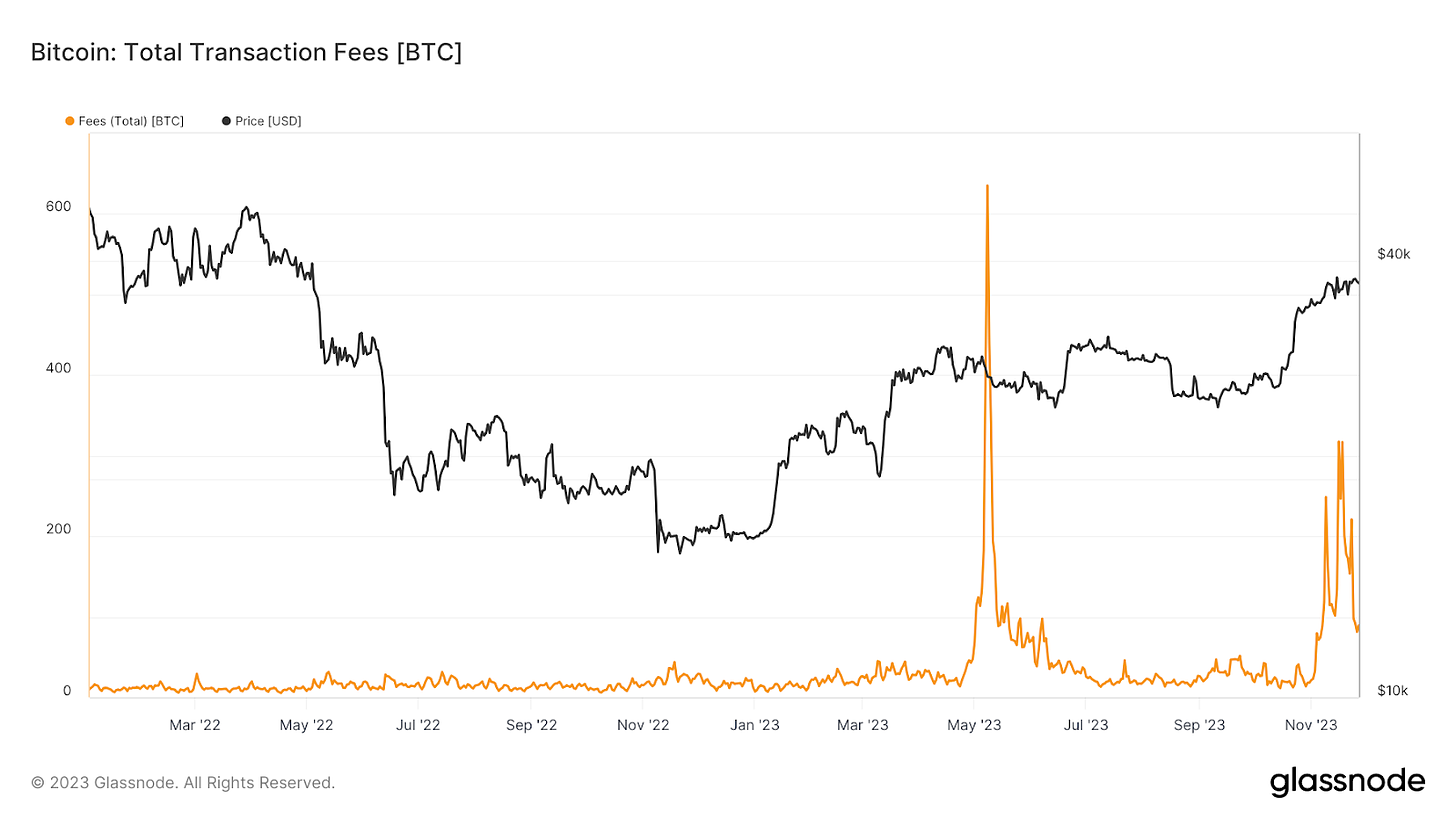
Speaking of NFTs, Ordinals have taken off in recent popularity but there is limited data on the way this is calculated. One hint that could help us see Ordinal activity is the increase of BTC total fees, which have increased to 316 BTC, the second highest of the past 24 months.
Over all the spikes in BTC fees, November 2023 has all of them except for one in the past 2 years, indicating a rapid spike in on-chain activity. With BTC price saying steady during this time, Ordinals could be a causality.
BTC Related to Decentralized Finance
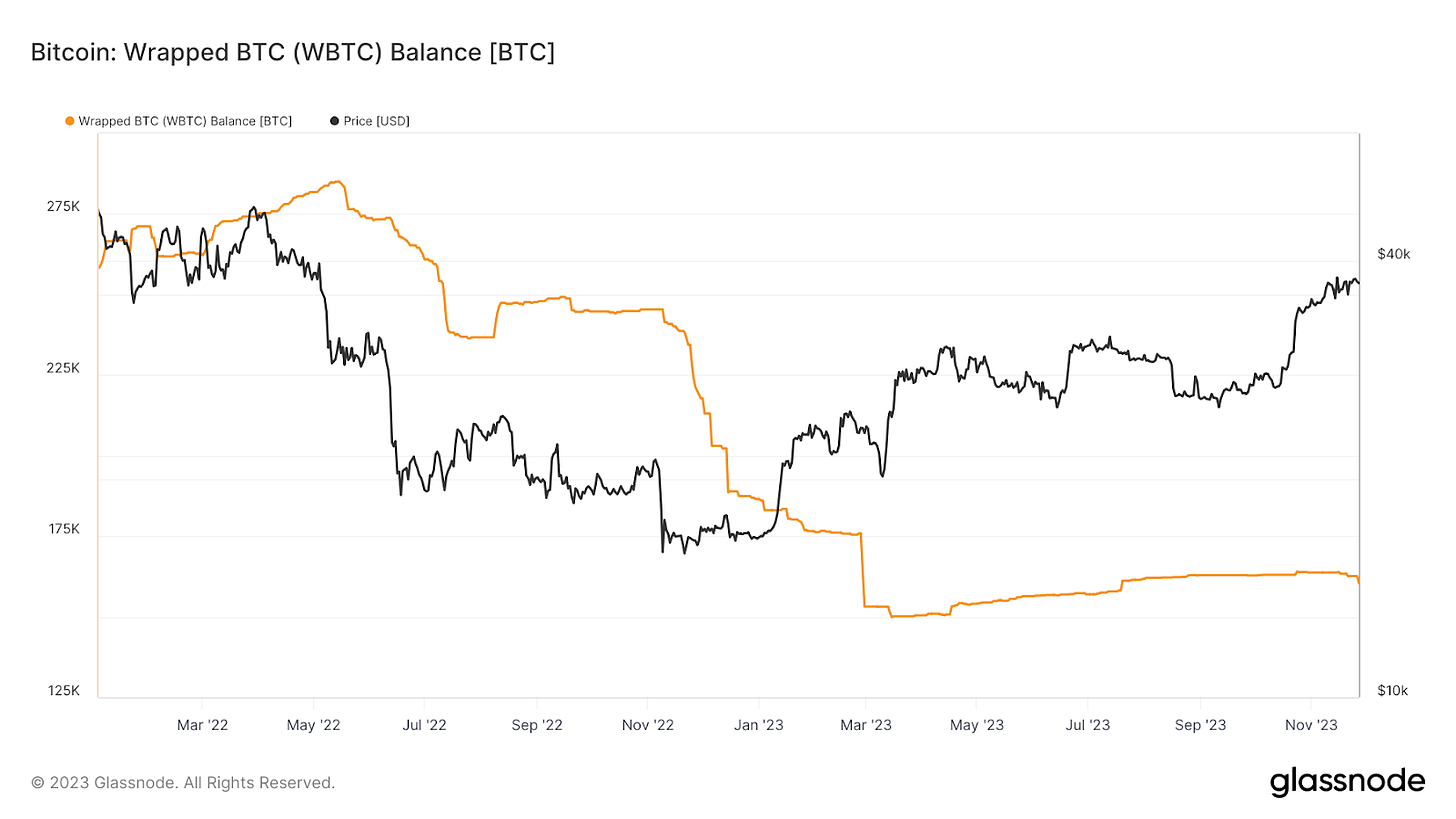
Wrapped Bitcoin is always an interesting topic but there has been a massive decrease in WBTC activity this year. Charts show that the current WBTC balance is matching lows from July 2023 and nearing an all time low in March 2023. There could be several ways to interpret this such as an increase to use BTC as a native chain especially as ETH is lagging in price performance compared to other chains. There is a likelihood that BTC is gaining much more significant activity apart from the rest of the market
Thank you for reading this Newsletter; if you did enjoy it and would like to stay up to date with any of my technical analysis moving forward, please do subscribe. I am currently trying to write something on the markets at least four times a month.
Thanks for always taking the time to read, I appreciate the support and reads.


